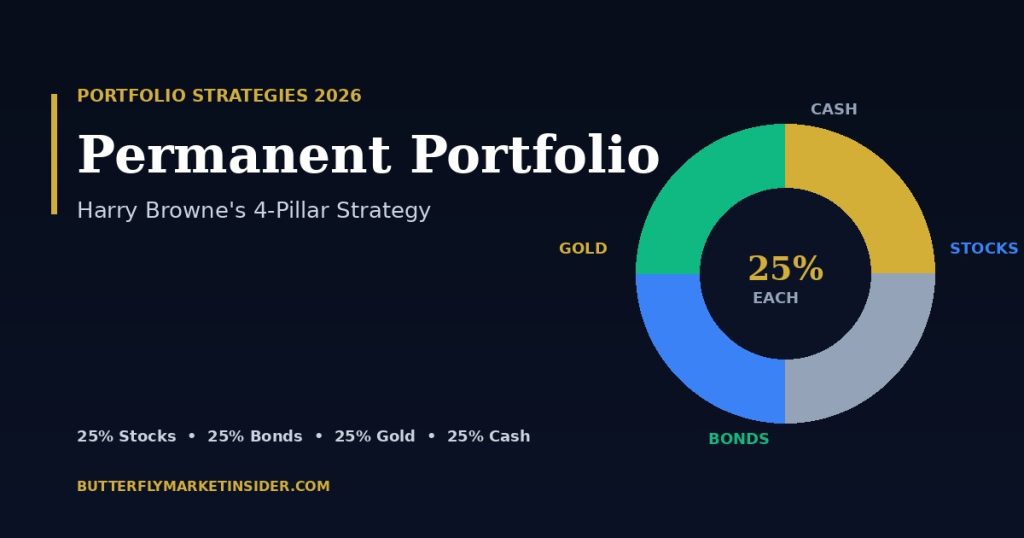
25 percent stocks, 25 percent bonds, 25 percent gold, 25 percent cash. For decades dismissed as too conservative — and in every single crisis (1973, 2000, 2008, 2020, 2022) the calm anchor of every portfolio that used it. Harry Browne’s Permanent Portfolio was published in 1981, is built on four economic regimes rather than market timing, and has delivered roughly 6 to 9 percent annual returns for half a century — with maximum drawdowns that put most equity rallies to shame. This guide covers the strategy, historical performance against MSCI World and 60/40, the European ETF implementation with ISINs, the 15/35 rebalancing rule, and the tax twist that makes gold particularly attractive for German investors.
1. Who was Harry Browne?
Harry Browne (1933 – 2006) was a US investment advisor, author, and twice the Libertarian Party’s presidential candidate. He became famous in 1970 with the book How You Can Profit from the Coming Devaluation, in which he correctly predicted that Nixon would abandon the gold standard — which Nixon then did on August 15, 1971. Anyone who followed Browne’s instructions and bought gold doubled their capital over the following decade.
From that experience — the 1971 shock, the double-digit inflation of the 1970s, the Volcker recession of 1981/82 — emerged in 1981 his second famous book Inflation-Proofing Your Investments (co-authored with Terry Coxon). It contained the first articulation of the Permanent Portfolio. The core idea: nobody can reliably predict which economic regime is coming next — so build a portfolio that always contains a winner and a loser in any regime. The result: never spectacular, never catastrophic, always calm.
2. The four pillars — and the economic logic
Browne distinguishes four possible economic regimes that every economy is in at any given time. Each regime has a clear winner among the four asset classes — and that’s exactly why the 25/25/25/25 split works:
Prosperity / Growth. The economy expands, corporate profits rise, consumers are confident. Stocks are by far the strongest asset class in this phase. Growth periods like 1995–1999, 2003–2007, 2009–2020, and 2023–2025 delivered double-digit equity returns.
Deflation. Prices fall, rates drift toward zero or below, growth weakens. Long-duration government bonds benefit most — falling rates push bond prices up. Classic example: Japan 1990–2010, the Eurozone 2014–2021. Anyone who held 30-year German Bunds with 2.5 percent coupons in 2014 made double-digit price gains by 2020.
Inflation. Prices rise faster than wages or interest rates. Stocks and bonds suffer — both have nominal, i.e. unprotected cash flows. Gold, on the other hand, has been the inflation asset par excellence for 5,000 years. 1971–1980: gold +1,300 percent. 2002–2011: gold +560 percent. 2022–2024 (post-pandemic inflation shock): gold +50 percent in EUR.
Recession / liquidity crunch. Markets panic, equities crash, sometimes gold sells off too (because investors need to meet margin calls). In this short, acute phase cash is king — it preserves value, doesn’t fall, and gives you the liquidity to buy the bargains that follow. Without cash, you wouldn’t have had reserves to buy the rally in March 2009 or March 2020.
3. Performance 1972–2025 — what actually happened
Tyler at portfoliocharts.com has tracked the Permanent Portfolio in USD since 1970. The numbers are remarkably consistent regardless of which start year you pick:
- 1972 – 2024: nominal CAGR ≈ 7.9 % p.a.; real CAGR (inflation-adjusted) ≈ 4.7 % p.a.
- 1980 – 2025: nominal CAGR ≈ 6.8 % p.a.; real CAGR ≈ 3.8 % p.a. — slightly weaker because the 1970s gold bull is excluded.
- Maximum real drawdown: ≈ –15 % (1980/81 — Volcker rate shock; 2022 — stocks, bonds and gold all fell simultaneously).
- Worst calendar year: 1981 at ≈ –4.6 %.
- Best calendar year: 1979 at ≈ +38 %.
- Volatility (standard deviation): ≈ 7 % — about half of 60/40, a third of 100 % stocks.
This is no return fireworks. But it’s a roller coaster on which nobody screams. The central question is: how much return are you willing to give up to never have to live through a 50 percent stress test? For many investors — especially those near or in retirement — the answer is: quite a lot.
4. Permanent Portfolio vs. MSCI World vs. 60/40
| Portfolio | CAGR nominal | Volatility | Max DD | Sharpe (rf=2 %) |
|---|---|---|---|---|
| Permanent Portfolio | ≈ 7.9 % | ≈ 7 % | ≈ –15 % | ≈ 0.82 |
| 60/40 (stocks / bonds) | ≈ 9.0 % | ≈ 10 % | ≈ –32 % | ≈ 0.70 |
| 100 % MSCI World | ≈ 9.8 % | ≈ 15 % | ≈ –54 % | ≈ 0.52 |
MSCI World has the highest absolute return but the worst Sharpe ratio — lots of volatility for each percentage point of additional return. 60/40 sits in the middle but in 2022 — with simultaneous bond and stock losses — produced its worst year since the 1930s (–17 %). The Permanent Portfolio comes in at 7.9 percent, only just below 60/40, but at half the volatility and a third of the maximum drawdown.
An important caveat: the comparison above is in USD. For European investors there’s an additional dimension — the EUR/USD exchange rate. Holding gold and US Treasuries automatically exports a piece of currency diversification into your portfolio. In phases when the euro weakens (2008, 2014–2016, 2022) that’s an additional return tailwind. Conversely, a strengthening euro depresses EUR-denominated performance.
5. ETF implementation for European investors (with ISINs)
Browne originally built his portfolio with US stocks (S&P 500), 30-year US Treasuries, physical gold, and money-market funds. For European investors there are two sensible approaches: strict Browne (everything in USD) or EUR-adjusted (home currency dominant). Both are valid — the EUR variant cuts FX risk but sacrifices some protection in a euro-denominated crisis.
| Pillar | ETF / ETC | ISIN | TER | Note |
|---|---|---|---|---|
| Stocks | iShares Core MSCI World UCITS ETF (Acc) | IE00B4L5Y983 | 0.20 % | Classic, 1,500+ stocks across 23 developed markets |
| Stocks (alt) | Vanguard FTSE All-World UCITS ETF (Acc) | IE00BK5BQT80 | 0.22 % | All-world incl. EM, broader diversification |
| Bonds (USD) | iShares USD Treasury Bond 20+ yr UCITS ETF (Acc) | IE00BSKRJZ44 | 0.10 % | Browne original — max duration → max deflation hedge |
| Bonds (EUR) | Xtrackers II Eurozone Govt Bond 25+ UCITS ETF (Acc) | LU0290357507 | 0.15 % | Eurozone government bonds, no FX risk |
| Gold | Xetra-Gold (DE) | DE000A0S9GB0 | 0.025 % | Physical, delivery right → 1-yr tax-free in DE |
| Gold (alt) | EUWAX Gold II | DE000EWG2LD7 | 0.00 % | Also German, also 1-yr tax-free in DE |
| Gold (non-DE) | iShares Physical Gold ETC | IE00B4ND3602 | 0.12 % | For AT/CH investors — Irish jurisdiction |
| Cash (MM ETF) | Xtrackers II EUR Overnight Rate Swap UCITS (Acc) | LU0290358497 | 0.10 % | €STR yield, low volatility, tradable in your brokerage |
| Cash (savings) | High-interest deposit account at a full bank | — | — | Simpler, deposit insurance €100,000 per bank |
A four-instrument setup is cheap (combined TER under 0.15 %), buildable in any European broker (Trade Republic, Scalable, Comdirect, ING, DKB, Interactive Brokers IE), and needs at most two savings-plan orders plus two one-shot trades per year. Anyone keeping cash in a deposit account rather than a money-market ETF saves even that effort.
6. Rebalancing — the 15/35 rule
Browne gave the portfolio its own rebalancing rule, deliberately not based on fixed calendar dates: the 15/35 rule. In plain English: rebalance only when one pillar drops below 15 percent or rises above 35 percent of the total portfolio. Then sell the over-weighted pillar and refill the weakest one back to 25 percent. The other two stay untouched.
Why this isn’t an arbitrary number: Browne tested historical data and found that annual rebalancing kicks in too early (you sell winners too soon, cut trends short), while a 50/50 trigger is too late (one pillar explodes to 60 percent and the portfolio tilts). 15/35 hits the sweet spot — across 50 years the rule fires on average only every 2 to 3 years, sometimes not for a decade.
In practice:
- Check quarterly: recalculate share, a short Excel column or portfolio tracker is enough.
- Threshold hit? Reset the pillar to 25 percent; redistribute the difference into the other three (evenly, or into the weakest).
- Mind taxes: selling stock ETFs triggers capital gains tax. If possible, rebalance via new contributions instead of sales.
7. Taxes — the German gold special case
This is perhaps the most under-appreciated advantage of the Permanent Portfolio for German investors: physical gold with delivery right is tax-free after a 12-month holding period. This is an exception in German tax law, codified in §23 EStG (private sales transactions, speculation period).
Concretely:
- Xetra-Gold (DE000A0S9GB0) and EUWAX Gold II (DE000EWG2LD7) qualify — they are structured as bonds with a delivery right to physical gold. After 12 months of holding, all gains are tax-free: no Abgeltungsteuer, no Solidaritätszuschlag.
- iShares Physical Gold (IE00B4ND3602) or WisdomTree Physical Gold (JE00B1VS3770) do not qualify — they’re domiciled in Ireland or Jersey, so the standard 25 % capital-gains tax applies.
- Stock ETFs: 25 % Abgeltungsteuer + Soli (5.5 %) + church tax if applicable, on dividends and realized gains. 30 % partial exemption (Teilfreistellung) at ≥51 % equity quota.
- Bond ETFs: 25 % Abgeltungsteuer + Soli, no partial exemption.
- Cash / money market: interest taxed at 25 %. Use the €1,000 annual saver’s allowance (Sparerpauschbetrag).
Austrian investors face a different regime: all securities gains are taxable in principle (KESt 27.5 %, or 25 % on cash interest), and the gold speculation period from German law doesn’t apply directly. Swiss investors enjoy a wealth-tax-only regime — capital gains on private holdings are generally tax-free (with exceptions for “professional securities trading”).
8. Variants — Golden Butterfly and Leveraged Permanent Portfolio
Golden Butterfly (Tyler / portfoliocharts.com). In 2016 Tyler extended the Permanent Portfolio with two additional pillars and split it into five equal slices:
- 20 % Total Stock Market
- 20 % Small-Cap Value (factor tilt)
- 20 % Long-Term Bonds
- 20 % Short-Term Bonds (instead of cash)
- 20 % Gold
The idea: the small-cap value factor (small, cheaply-valued companies) historically delivers a return premium of roughly 2 % p.a. over the broad market (Fama/French). Over 50 years that lifts CAGR to roughly 8.5 % nominal with barely higher volatility. Swapping cash for short-term bonds adds a touch more yield. portfoliocharts.com backtests show worst-case real drawdown comparable to the classic PP — about –12 to –15 percent.
European implementation: Avantis Global Small Cap Value (IE000Y77LGG9) or SPDR MSCI World Small Cap Value Weighted (IE00BSPLC413) for the small-cap-value sleeve; iShares EUR Govt Bond 1-3 Year (IE00B14X4Q57) for the short-term-bonds sleeve.
Leveraged Permanent Portfolio. The Reddit community r/HEDGEFUNDIE popularized in 2019 a variant with 1.5x to 3x leverage on the classic 25/25/25/25 setup using LETFs (leveraged ETFs). The pitch: since the PP has low volatility, leverage can boost return without producing equity-style drawdowns. In theory.
Backtests look attractive — until 2022. The simultaneous crash of stocks and bonds (a bond bear market of historic proportions) flushed the leveraged PP through –40 % to –60 % drawdowns. This variant is not for calm sleepers, and in the EU it’s regulatorily hard to implement anyway (LETFs on Treasuries are barely available as UCITS). We don’t recommend it.
9. When does the Permanent Portfolio fit you?
Browne never designed the strategy as a maximizer — he designed it as a sleeping pill. That’s not ironic. If your investment horizon is 30+ years and you can truly stomach volatility, the higher equity allocation has historically always delivered more terminal wealth. But few people in practice hold 100 % stocks through a 2008/09-style phase — most sell at the bottom.
The Permanent Portfolio typically fits you if:
- You’re heading into retirement (or close to it): drawdown protection more important than maximum return.
- You can’t sleep through crises: most investors panic-sell at –40 %; with PP you don’t even face that question.
- You don’t actively trade: set it once, check once a year, done.
- You see global crisis or hyperinflation as plausible: gold is your survival asset here.
- You want to “permanently park” part of your wealth: e.g. 50 % in PP, 50 % more aggressively in equities — a barbell strategy.
When it does not fit: if you’re under 35, have a 30-year horizon, can mentally stomach a high equity quota, and would find ~3-percentage-points-per-year underperformance vs. MSCI World during a long growth phase (like 2010–2020) painful. Then 70/30 or 80/20 is typically more efficient.
10. FAQ & Bottom Line
Does the Permanent Portfolio also work in Europe? Yes. The economic regimes — growth, deflation, inflation, recession — are universal. What changes is the specific asset vehicles (US Treasuries vs. eurozone government bonds). EUR-denominated backtests since 1990 show comparable results with somewhat higher volatility due to FX effects.
Is 25 % gold not too much? A lot — most advisors recommend 5–10 %. Browne explicitly wanted a pillar that could rescue the entire portfolio in an inflation or currency crisis. With 5 % gold you don’t get that. The 25 % is not arbitrary — it’s the minimum that actually makes a difference in a crisis.
What about Bitcoin/crypto? Browne lived before Bitcoin. Some modernized variants replace 5 % gold with 5 % Bitcoin (BlackRock IBIT/BTCE-style logic). It’s defensible but in a banking-crisis-style liquidity crunch Bitcoin is more volatile than gold. We wouldn’t reduce the gold quota.
Why is cash so important? It earns nothing. Cash is the only asset that reliably rises in purchasing power during a liquidity shock. Without cash, you can’t buy cheaply during a crash. The 25 % is not “return drag” — it’s “option value”.
Is 6–9 % CAGR enough? At 6 % real, your capital doubles in 12 years and quadruples in 24. With monthly contributions (DCA) it’s more than enough for long-term wealth-building, without losing everything in a single 50 % crisis.
Can I combine the Permanent Portfolio with the DCA Simulator, the Correlation Matrix or the Smart Money Tracker? Yes — the DCA Simulator shows how monthly contributions compound over decades, the Correlation Matrix verifies that your pillars are actually uncorrelated, and the Smart Money Tracker reveals whether institutional investors like Ray Dalio (All-Weather) run similar allocations.
The Permanent Portfolio is not an alpha generator — it’s an insurance with positive expected return. Across 50 years it delivers ~7–8 % nominal with minimal upkeep at one third the volatility of 100 % stocks. The 15/35 rule limits the workload to a quarterly check, the four-ETF setup with Xetra-Gold (DE000A0S9GB0) is built in any European brokerage in 30 minutes, and the German gold tax exemption after 12 months is a hidden return turbocharger. If your sleep matters more than the last percentage point of CAGR — this is your portfolio.
Disclaimer: This article is not investment advice. Past performance is no guarantee of future results. ISINs and TER values as of 2026; please verify the current factsheet before any purchase.
Try TradingView Free for 30 Days
Plus get a $15 discount on your first subscription through this link.
Ray Dalio Investment Principles — as PDF
The key lessons from "Principles", the All Weather Portfolio and Bridgewater — distilled into 12 pages. The cheat sheet every investor needs.
- The 5 most important investment principles
- All Weather Portfolio: concrete allocation
- Risk Parity, plainly explained
- Lessons from 50+ years of Bridgewater
🔒 No spam. Just the PDF and occasional smart-money updates.