
This is BMInsider PRO content
You're reading a Deep Dive — our most in-depth research. Unlock full access to all analyses, Smart Money breakdowns & more.
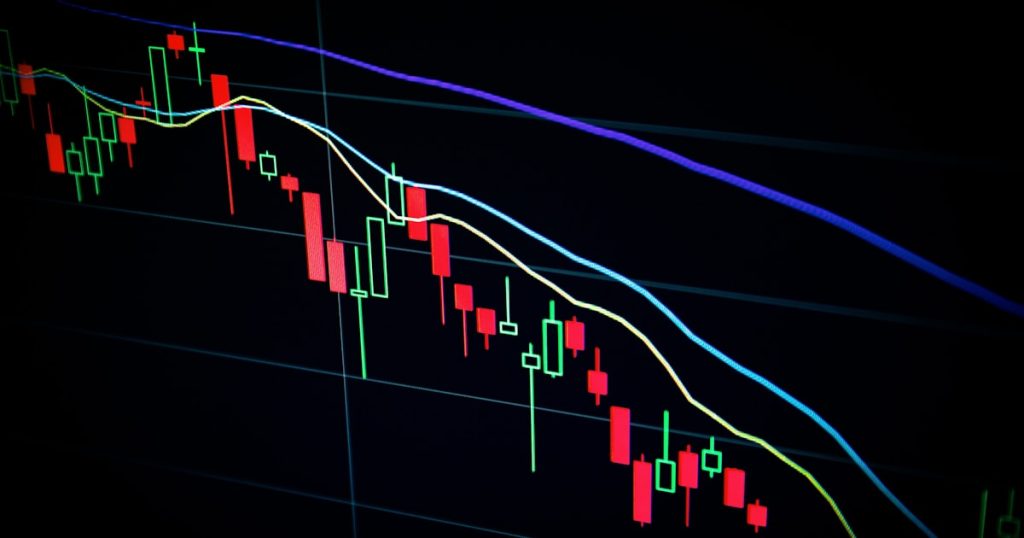
Unlock BMInsider PRO →While the world watches the Iran crisis unfold in real-time, a technical development in the S&P 500 has quietly emerged that deserves far more attention than it is receiving. In late March 2026, the index’s 50-day moving average crossed below its 200-day moving average — the so-called Death Cross.
The name sounds dramatic, and it is sometimes dismissed as market folklore. But the data tells a more nuanced story — one that investors should take seriously given the current macro backdrop.
What the Data Actually Shows
Since 1950, the S&P 500 has experienced approximately 30 Death Crosses. Their track record is mixed but tilts bearish when they occur during periods of genuine fundamental deterioration rather than temporary corrections.
In cases where the Death Cross coincided with a recession or major geopolitical shock, the average subsequent decline over 3 months was 7.4%. In cases where the Death Cross was a false signal during a bull market correction, the index typically recovered within 2–4 months.
The key question is which category the current Death Cross belongs to. The answer depends largely on the Iran crisis and its impact on inflation, corporate earnings, and Federal Reserve policy.
Why This Time May Be Different
Several factors distinguish the current Death Cross from recent false signals. First, it is occurring against the backdrop of the largest oil supply disruption in history. Unlike previous corrections driven by sentiment or valuation concerns, the current decline is rooted in a genuine economic shock — rising energy costs that directly impact corporate margins and consumer spending.
Second, the S&P 500’s concentration in technology stocks creates a vulnerability. The Magnificent Seven (Apple, Microsoft, Nvidia, Amazon, Alphabet, Meta, Tesla) still represent approximately 30% of the index’s weighting. These companies face a triple headwind: rising interest rates that compress growth multiples, increasing energy costs that raise data center operating expenses, and growing investor skepticism about the pace of AI monetization.
Third, the Federal Reserve is trapped. Inflation expectations have risen sharply due to the oil shock, making rate cuts politically and economically difficult. But maintaining high rates while the economy absorbs a historic energy price spike risks tipping the economy into recession. The Fed’s next meeting in May will be one of the most consequential in years.
The Technical Levels to Watch
The S&P 500 currently sits at approximately 6,582. The critical support level is 6,500 — a psychological round number that also aligns with the January 2026 low. A break below 6,500 would likely trigger algorithmic selling and could accelerate the decline toward 6,200–6,300.
On the upside, the 200-day moving average at 6,644 represents the first major resistance level. A decisive close above this level would invalidate the Death Cross signal and likely trigger short-covering. The 50-day moving average at 6,783 represents the second resistance level and would signal a definitive trend change if recaptured.
The RSI currently reads 46.2% — neutral territory that provides little directional guidance. Volume on the recent rally attempt has been below average, suggesting a lack of conviction among buyers.
What Investors Should Do
The Death Cross is not a sell signal in isolation. It is a warning light that tells investors to pay attention, reduce risk where appropriate, and prepare for the possibility that the current correction could deepen.
Specifically, consider reducing exposure to rate-sensitive growth stocks with stretched valuations. Increase allocations to energy, defense, and value names that benefit from the current macro environment. Maintain a higher-than-normal cash position — not as a permanent allocation, but as dry powder for opportunities that may emerge if the correction deepens.
Track the BMInsider Fear & Greed Index daily. When the index reaches Extreme Fear territory, historically it has signaled the best buying opportunities of the subsequent 12 months.